
- Performance — what Neo did for you: time saved, tickets covered, and how often work finished without a human.
- Cost Analysis — where your spend goes, broken down by workflow, agent, and chat.
Deciding what to automate first? Neo Insights projects the hours and money you could save — for your whole desk, a single end-client, or specific months — before you build anything.
Performance
The Performance tab answers “what did Neo accomplish?” Use the Agents / Workflows / All toggle to scope every metric, and the period selector (top right) to choose the window. Presets wider than your history are disabled — the header shows Execution data since the first run. At the top, three tiles set what Neo saved against what it cost: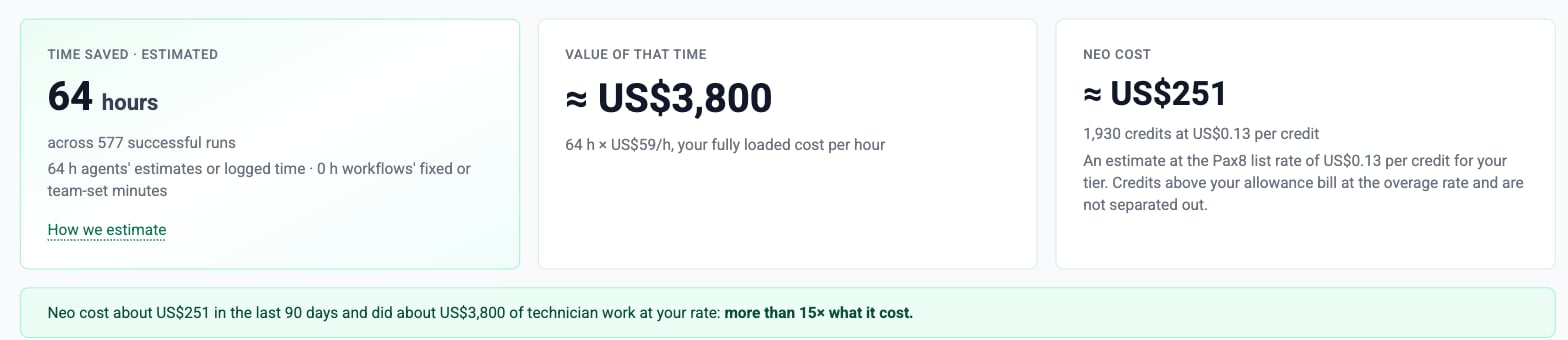
Until an admin enters your own cost per hour, Value of that time uses the typical rate for your region, shows smaller, and is marked typical US rate (or your region). Click the mark to enter your own rate.
You may pay Neo in one currency and enter your cost per hour in another, for example US dollars against pounds. Neo cost is then converted into the currency of your hourly cost at the European Central Bank’s reference rate of the last business day, and the line under it gives the billed figure: from $3,385 at the ECB rate of 2 Oct 2026. Every other page keeps credits in your billing currency.
Under the tiles, one line can compare the two: Neo cost about £2,600 this month and did about £41,000 of technician work at your rate: more than 15× what it cost. It shows only when all four hold:
- An admin entered your own cost per hour. The typical rate never produces the line.
- Neo knows your price per credit, and the cost is in the same currency as the value, converted at the ECB rate when needed.
- The period has at least 100 runs that recorded time saved.
- The multiple is above 5×. It is rounded down (to a whole number under 10×, to a multiple of 5 above), so it always understates.
Your cost of technician time
Neo prices the hours it saves at your fully loaded cost per hour: a technician’s gross salary plus employer taxes, benefits and overhead, divided by the hours they work. It is usually 1.25 to 1.4 times the hourly salary. An admin or owner sets it under Settings → Your cost of technician time, then Save Settings; everyone else can read it there.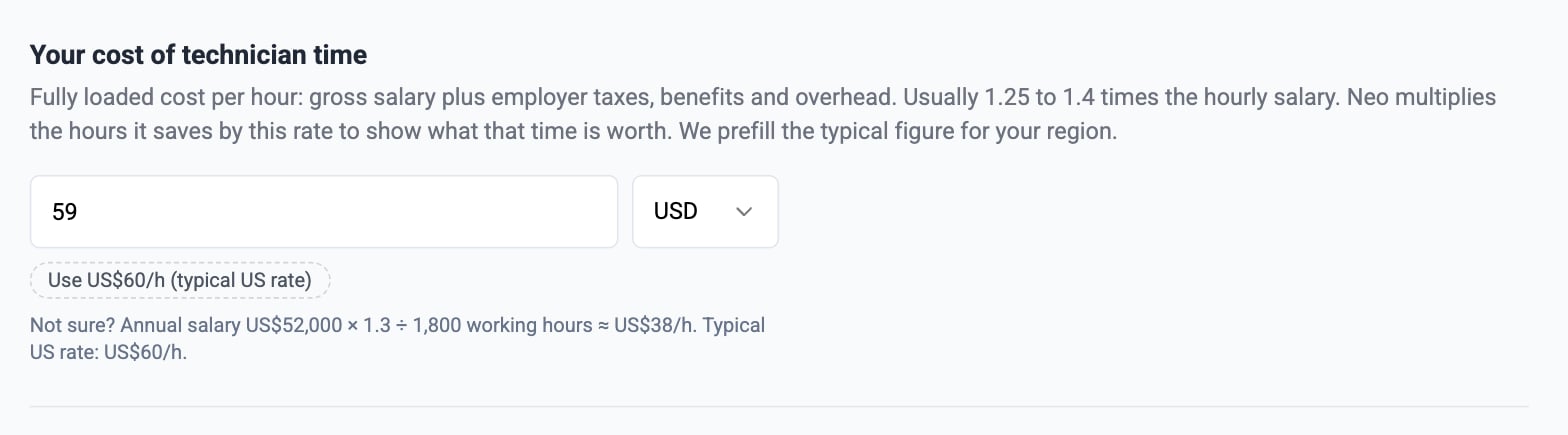
Your region comes from the currency you are billed in, else your timezone, else where your data is stored. The same rate prices Neo Insights, so both pages agree. You can also ask the Neo Support Agent to set it.
Cost Analysis
The Cost Analysis tab breaks spend into three views:Chat agents
The Chat Agents view reports conversational usage, split by audience with the Internal / End-user toggle — because the two are billed on completely different models. Like the Performance tab, it counts only the agents you can view.Internal — your technician-facing agents
Internal covers the chat agents your technicians talk to: the built-in Neo Support Agent plus any dashboard or Teams chat agents you’ve built. These draw from your credit pool, billed per tool call — a turn with no tool calls is free. Pick a month to see:- Credits Used, Messages, Sessions, and Active Agents cards
- Chat credits & messages over time — daily credits against message volume; a day with no messages shows as zero
- Per-agent and per-user tables showing who and what is spending
- Tool usage — calls and credits per tool, with plumbing tools (loading skills, Neo’s API, memory) tagged Free so you can see what actually draws credits
End-user — your branded Teams bot
End-user covers your white-label end-user Teams bot — the branded bot your clients’ employees message in Microsoft Teams. It is not billed in credits; it’s priced per client company — a flat monthly price for each client where someone used the bot, and nothing for the rest — separate from your credit pool. The full pricing model lives in Chat sessions & billing. Pick a month to see:- Active Users (anyone who messaged the bot), Projected charge for the month, Tickets Raised by the bot, and Status — free trial with days remaining, active, trial ended, or disabled — with a shortcut to Billing
- Active users over time — the monthly-active-user trend
- Agents — messages and sessions per end-user agent (no credits; it’s billed per client company, not per message)
- End-clients — active users, tickets and the month’s price per client company, expandable to each employee and the specific tickets they raised. Clients nobody used the bot in show as $0.
The end-user bot runs a 14-day free trial — usage appears here from day one, but nothing is charged until the trial converts. See Chat sessions & billing for trial and billing mechanics.
How to access
1
Open Performance & Cost
Select Performance & Cost from the main menu, or go straight to dashboard.neoagent.io/analytics.
2
Choose a tab
Switch between Performance to measure impact and Cost Analysis to track spend.
3
Scope and filter
On Performance, use the Agents / Workflows / All toggle and the period selector. On Cost Analysis, pick Workflows & Agents, Dispatch, or Chat Agents, then a month.
4
Drill into a run
For step-by-step detail on any single execution, open Executions.
Why it helps
- Prove ROI — show concrete time saved and ticket coverage from Neo’s automations and agents.
- Control cost — see which workflows, agents, tools, and chats consume the most credits, and where your end-user charges come from.
- Spot issues early — a drop in success or resolution rate, or a spike in credits, surfaces here before it becomes a surprise.