Analytics
Neo Agent provides powerful analytics to help you measure, monitor, and improve your MSP operations. The Analytics dashboard offers insights into workflow performance and credit consumption, allowing you to optimize your automation strategies.
What You Can Track
Neo Agent's analytics capabilities allow you to monitor various aspects of your automation:
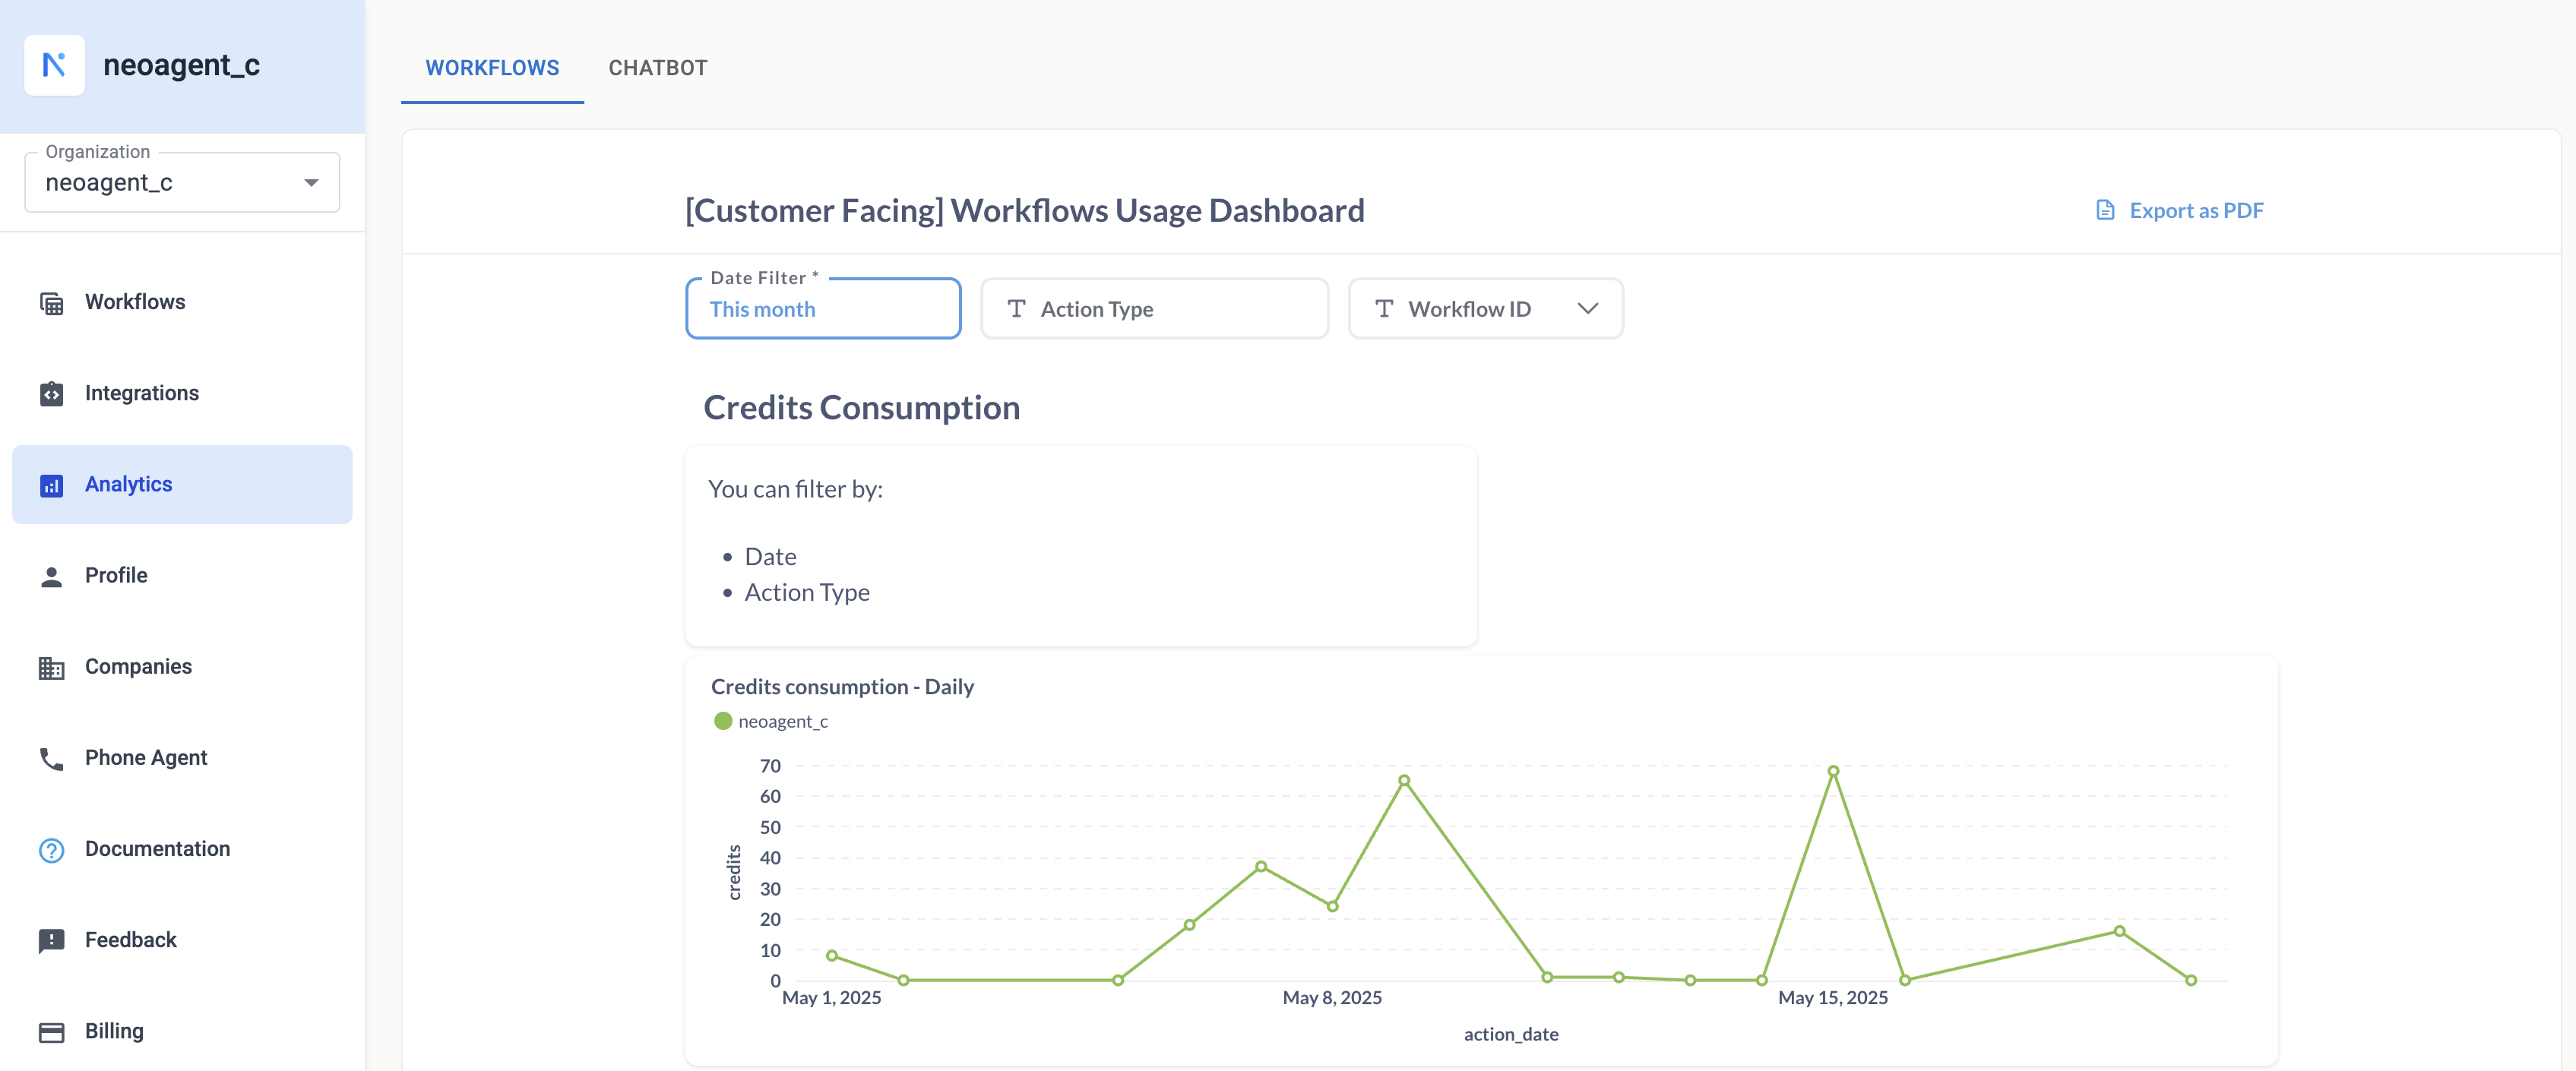
Credits Consumption
- Credits Consumption - Daily: Visualize the daily trend of credits used by your automations. This helps in understanding peak usage times and overall consumption patterns.
- You can filter this data by:
- Date: Select a specific time range (e.g., This month, Last month, Custom range).
- Action Type: Focus on credits consumed by particular types of actions.
- Workflow ID: Analyze credit usage for specific workflows.
- You can filter this data by:
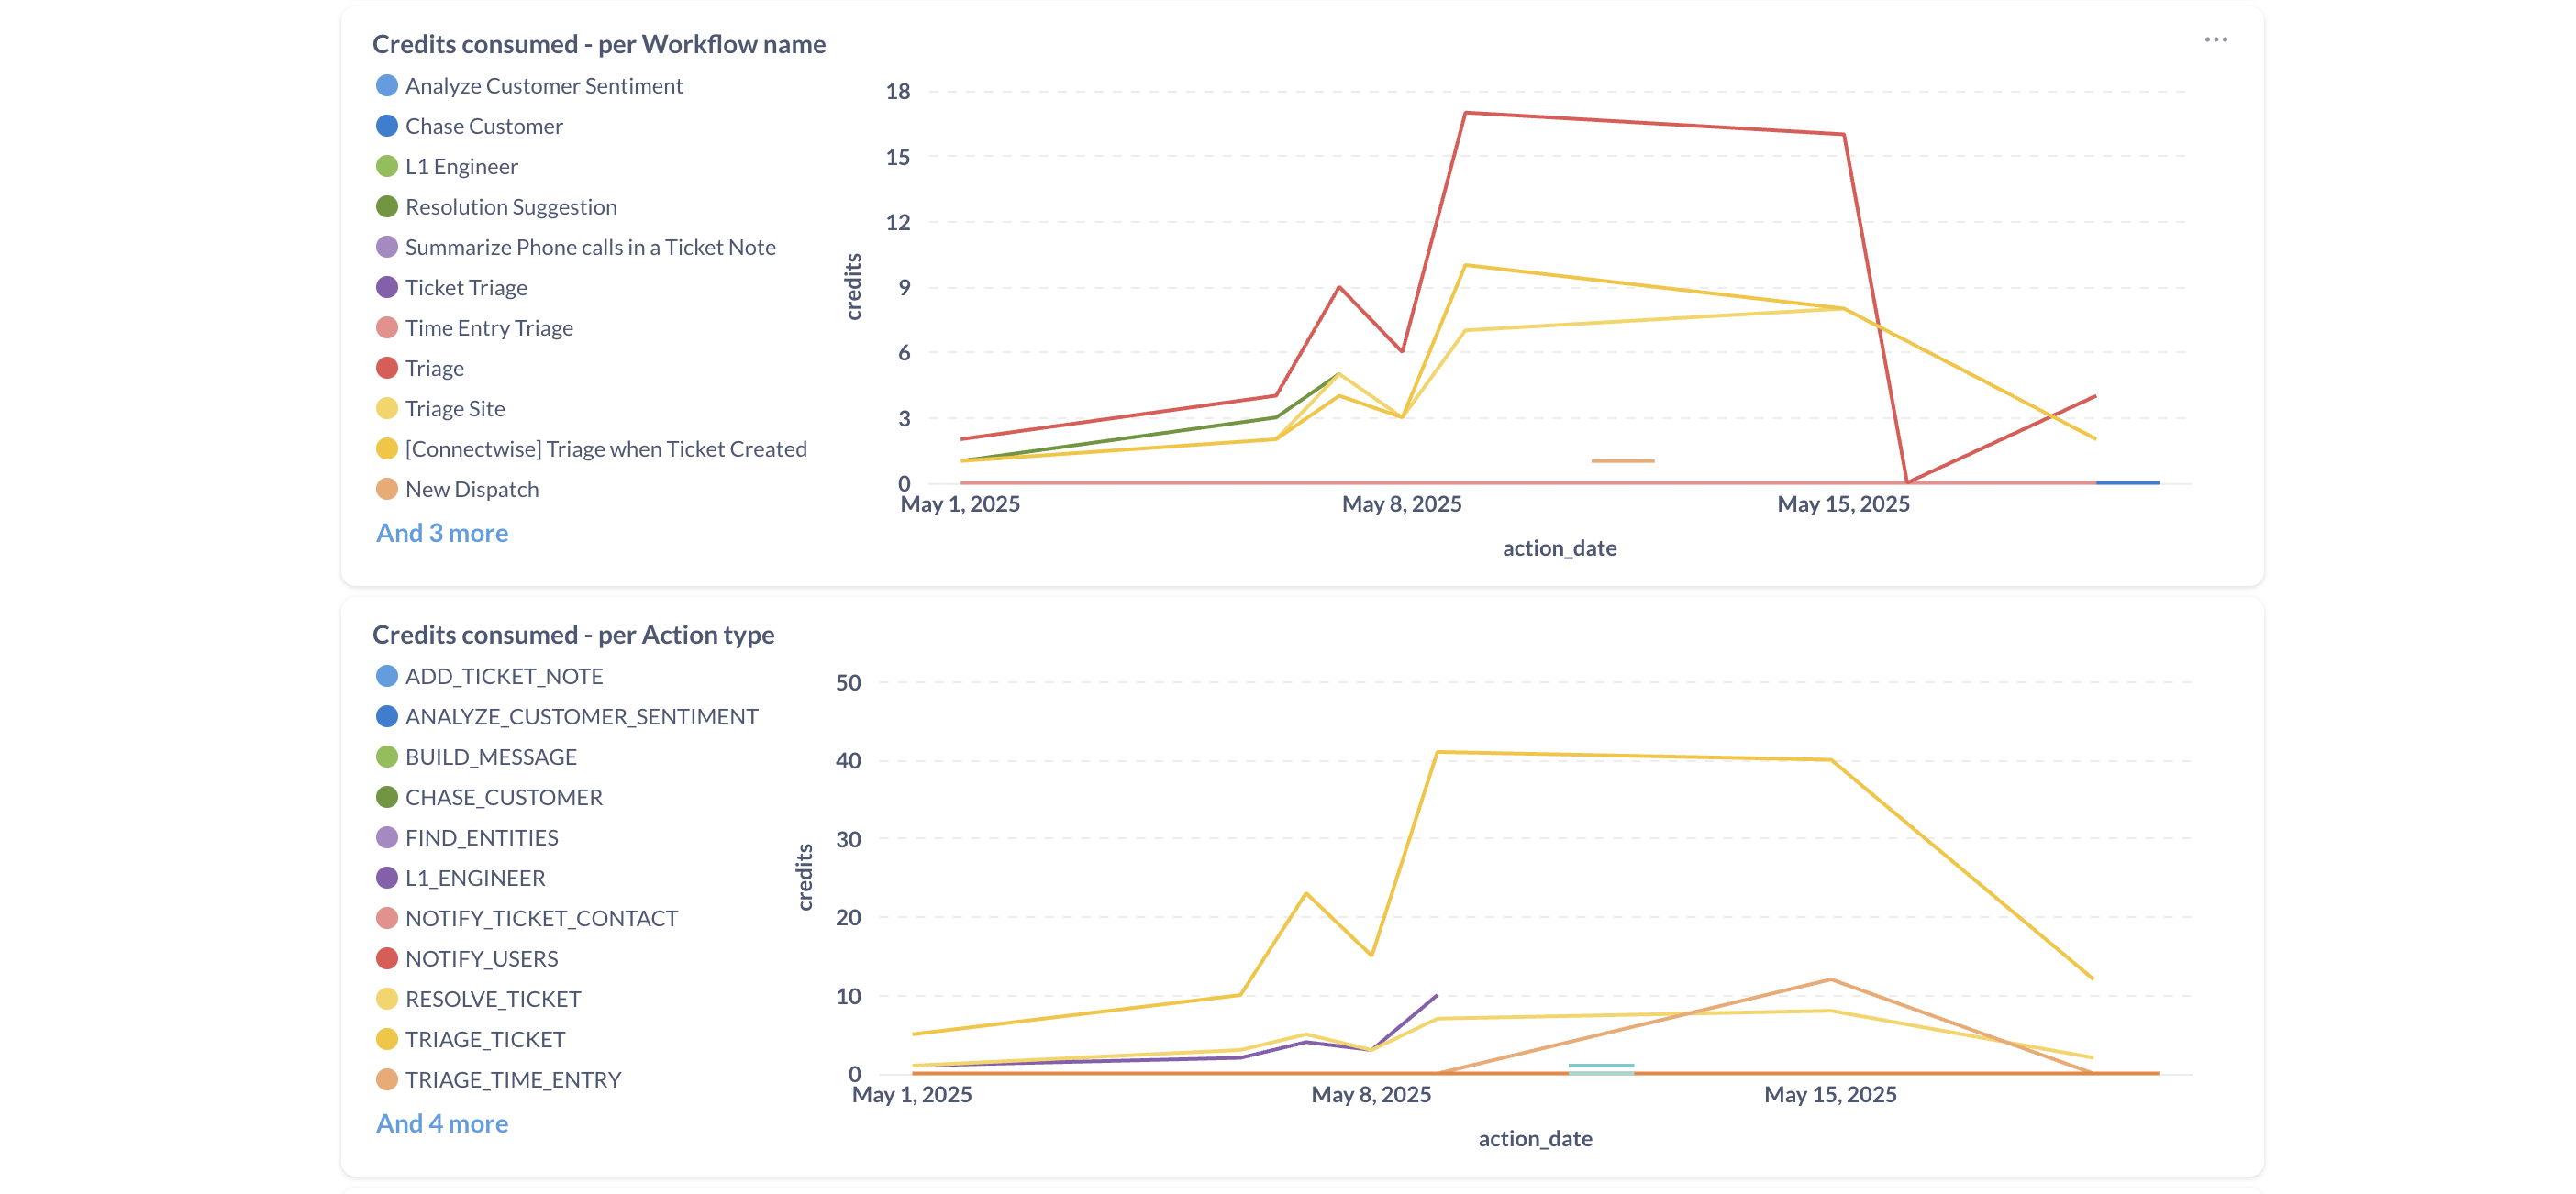
- Credits Consumed - per Workflow name: See a breakdown of credits consumed by each workflow over the selected period. This chart helps identify which workflows are the most credit-intensive.
- Credits Consumed - per Action type: Understand credit distribution across different action types (e.g.,
ANALYZE_CUSTOMER_SENTIMENT,L1_ENGINEER,TRIAGE_TICKET).
Total Credits Spent
- Total credits spent over time period: A bar chart showing the total credits spent by client_name for the selected date range. This gives a high-level view of overall credit usage.
- Total credits spent - per Action type: A horizontal bar chart illustrating the total credits consumed by each action type. This is useful for identifying which actions contribute most to your credit usage.
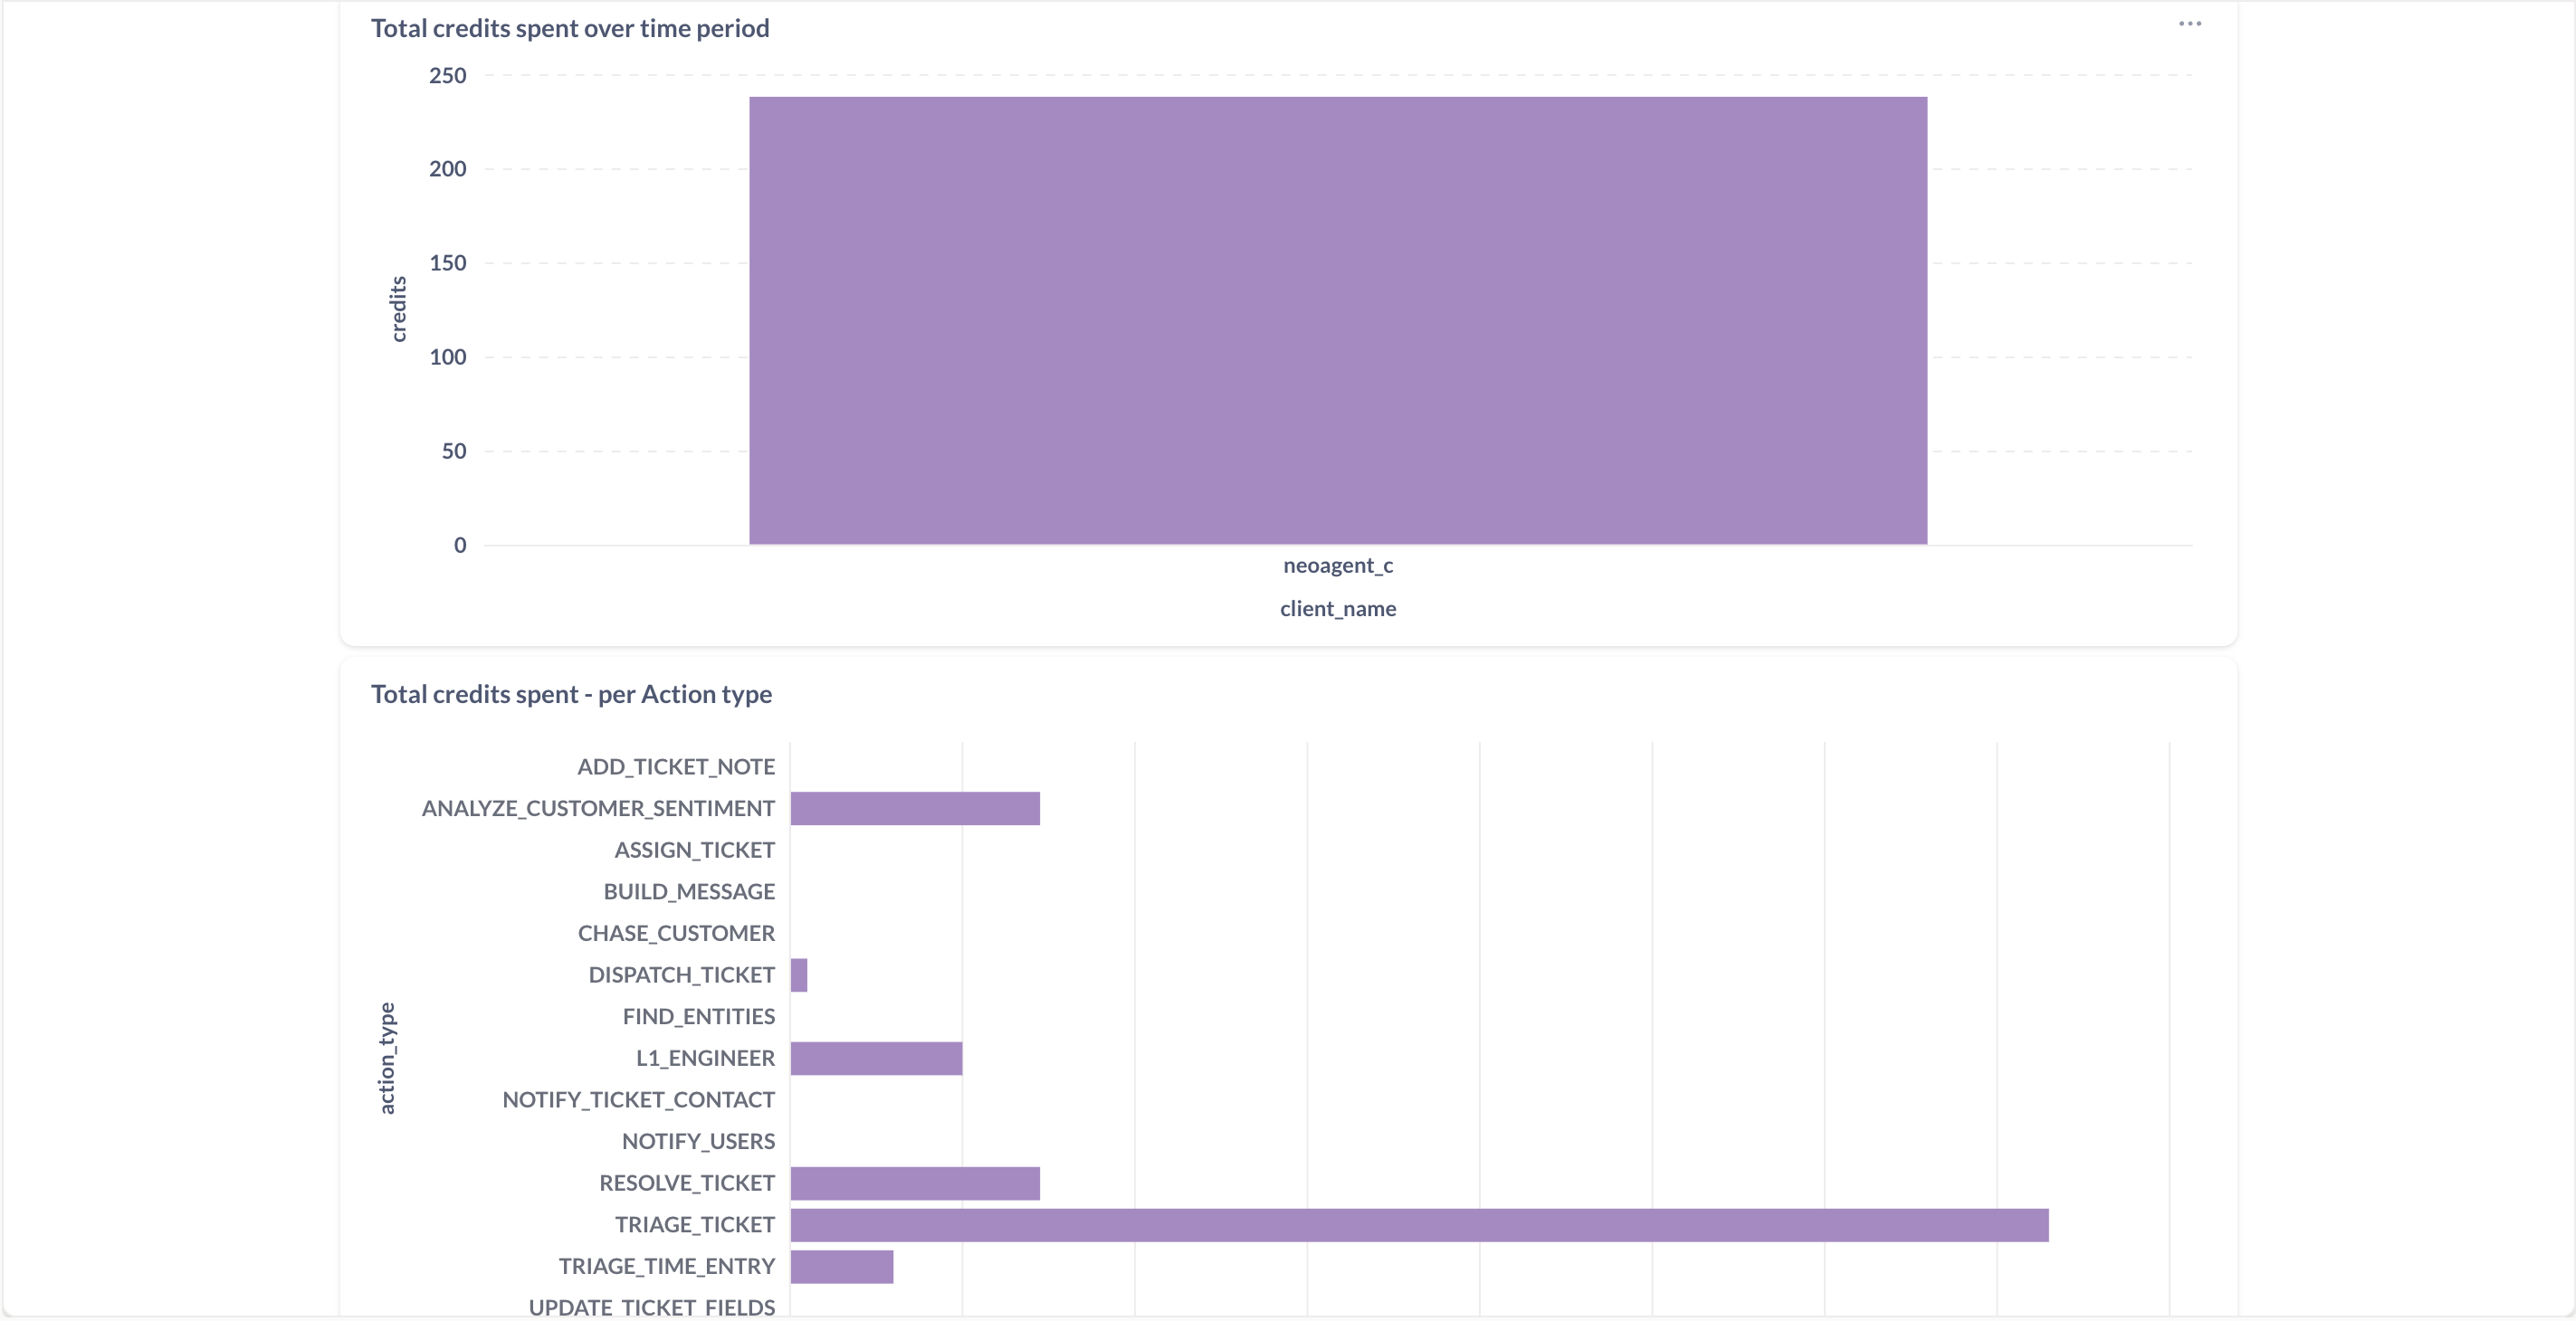 The bar charts provide a clear overview of total credit expenditure, broken down by action type and workflow name.
Total Credits Spent per Workflow Name
This chart is often the most direct way to understand and analyze credit consumption per automation.
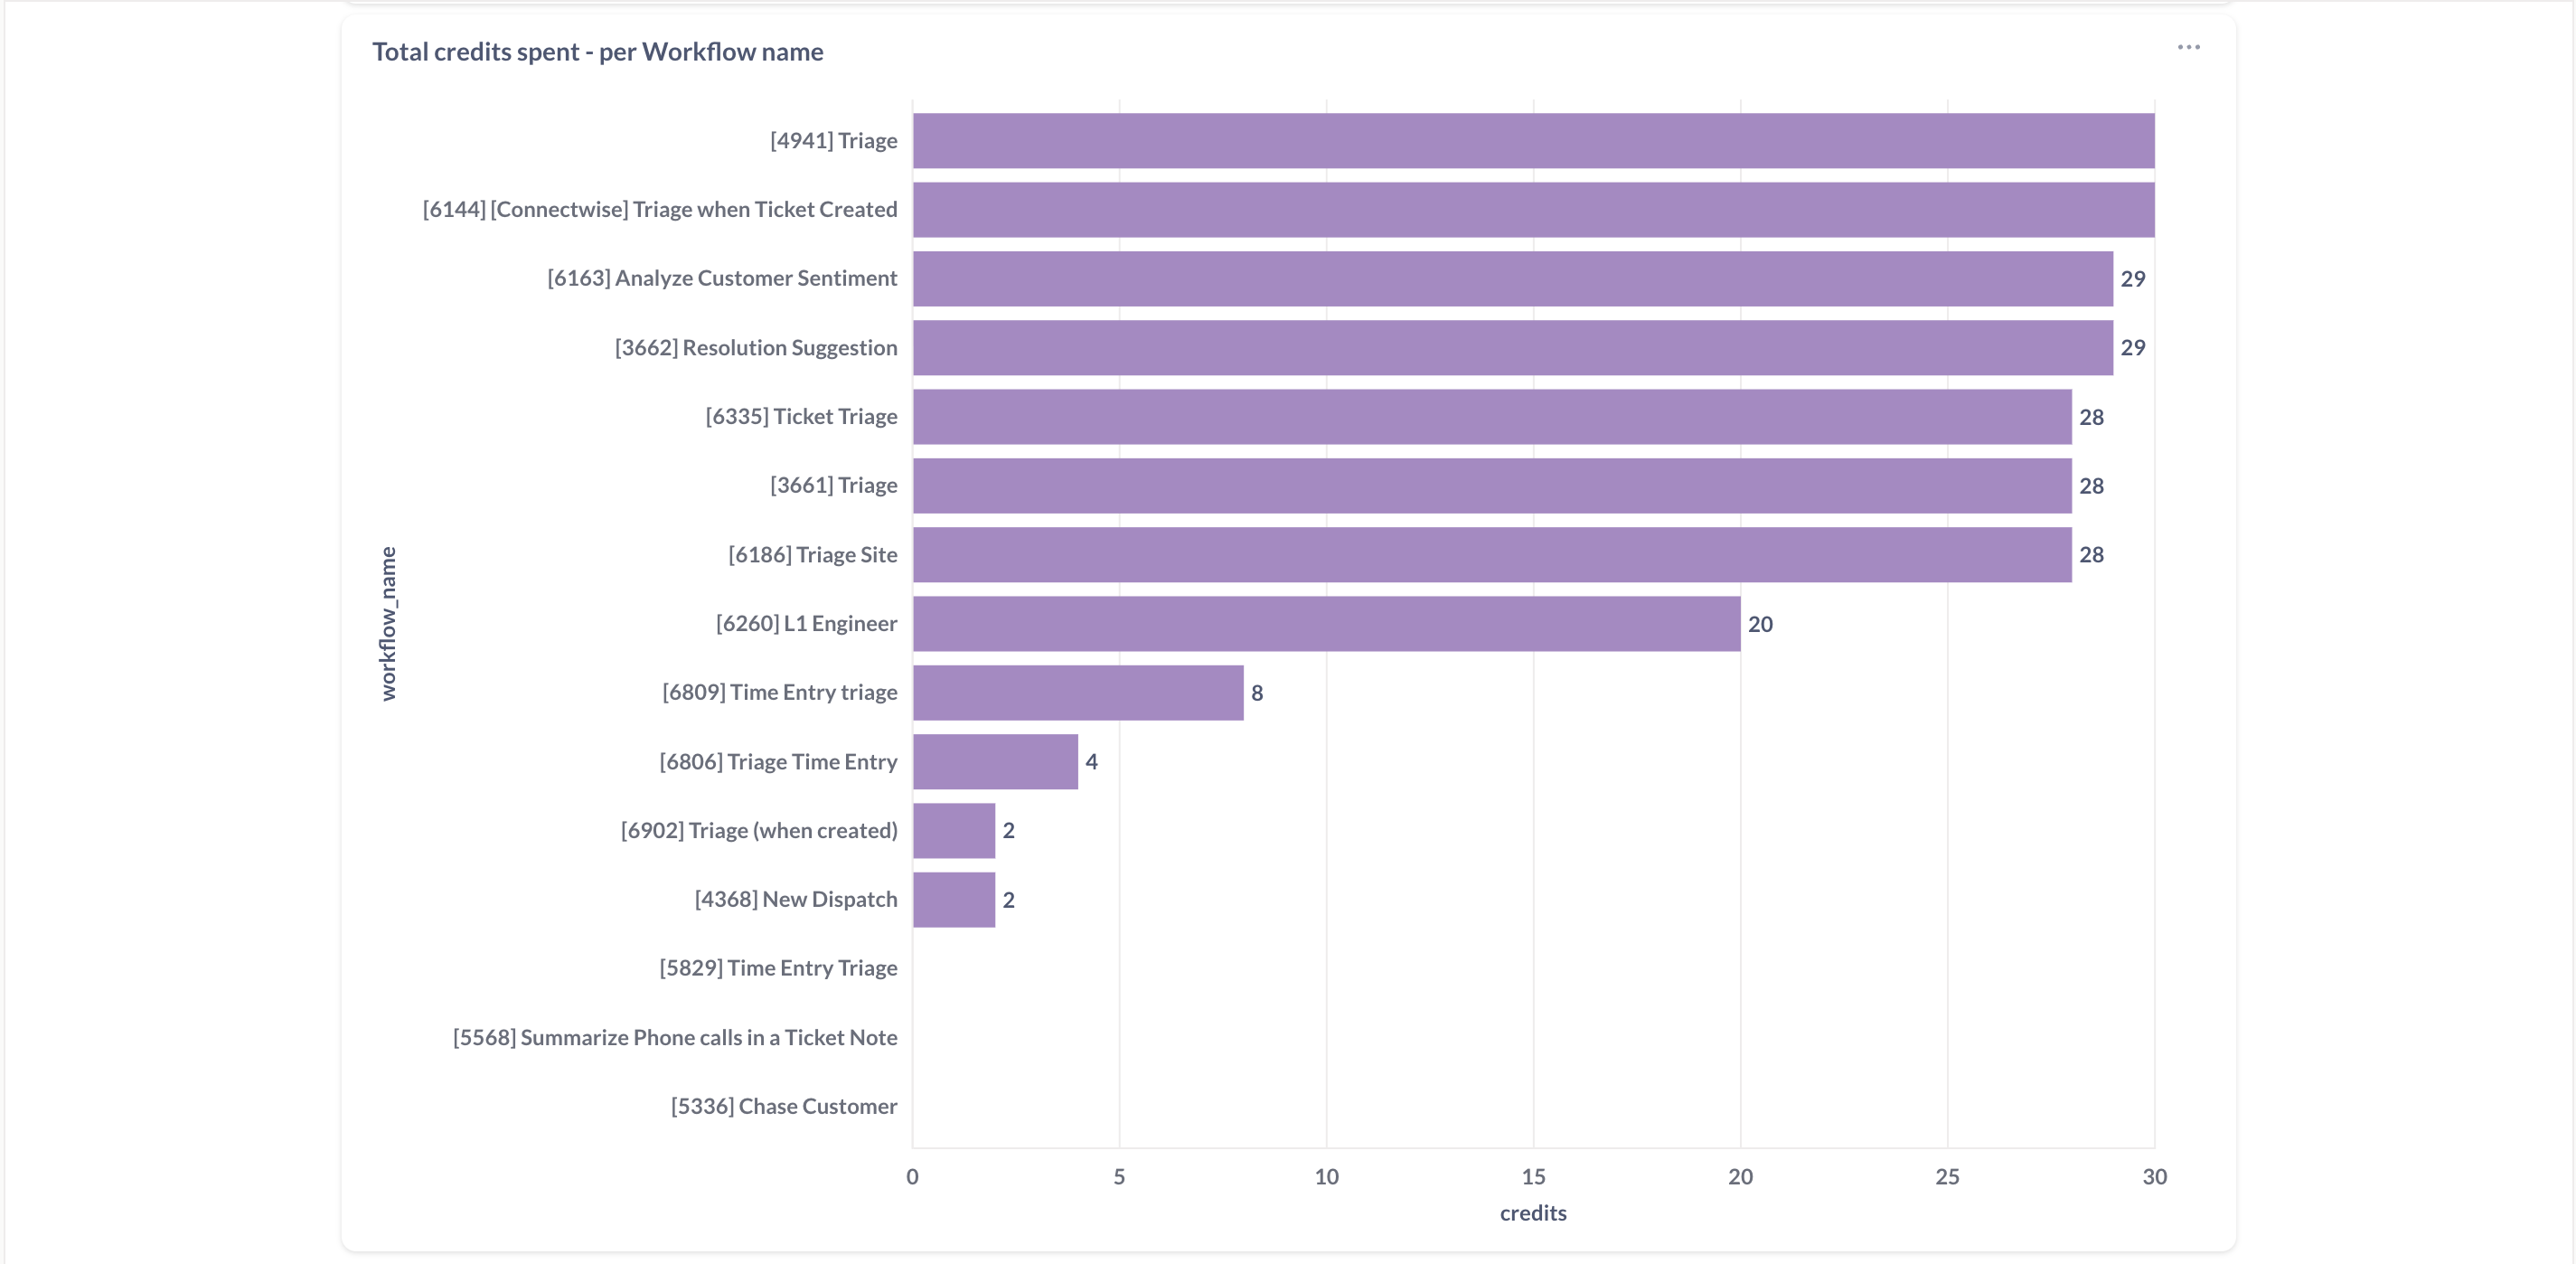
This detailed bar chart shows the credit consumption for each specific workflow, helping pinpoint high-usage automations.
Workflow Execution Metrics
While not directly shown as charts on the main analytics page, Neo Agent tracks detailed workflow execution statistics. You can leverage this data, often accessible via the Event History or specific workflow views, to understand:
- Total Executions: The number of times a workflow has run.
- Successful Executions: The count of workflows that completed without errors.
- Failed Executions: The number of workflows that encountered errors.
- Average Execution Time: The typical time taken for a workflow to complete.
- Last Execution Time: When the workflow last ran.
Action Execution Metrics
Similarly, Neo Agent logs data for each action executed within a workflow:
- Action Type: The type of action performed (e.g.,
ADD_TICKET_NOTE,RESOLVE_TICKET). - Inputs and Outputs: The data an action received and produced.
- Result Status: (Success/Failure).
- Seconds Spent: Duration of the action.
- Tickets Processed: A key metric for understanding credit usage, as many Smart Actions consume credits based on the number of tickets processed.
How to Access Analytics
- Navigate to the Analytics section from the main menu in Neo Agent.
- Use the Date Filter at the top to select the time period for which you want to view data (e.g., "This month", "Last 7 days", "Custom Range").
- Optionally, use the Action Type and Workflow ID dropdowns to further refine the "Credits Consumption - Daily" chart.
- Explore the different charts to understand credit usage patterns and identify areas for optimization.
- For more granular details on specific workflow runs or action executions, refer to the Event History.
Benefits
- Identify Bottlenecks and Optimize Workflows: Pinpoint workflows or actions that are consuming a high number of credits or taking a long time to execute, and identify opportunities for optimization.
- Demonstrate ROI of Automation: Use concrete data to show the value and efficiency gains achieved through Neo Agent's automations.
- Monitor Credit Usage: Keep track of your credit consumption to manage costs and ensure you are within your expected usage.
- Continuously Improve Service Quality: By understanding how your automations are performing, you can make informed decisions to enhance their effectiveness and reliability.
Regularly review your analytics to guide your automation strategy, optimize credit consumption, and showcase your team's success. For deeper dives into specific workflow behaviors or troubleshooting, the Event History is an invaluable resource.